menu

Saturday 15 November 2014

Ben Geen: another possible case of miscarriage of justice and misunderstanding statistics?


Norman Fenton, 15 Nov 2014

Imagine if you asked people to roll eight dice to see if they can 'hit the jackpot' by rolling 8 out of 8 sixes.  The chances are less than 1 in 1.5 million. So if you saw somebody - let's call him Fred - who has a history of 'trouble with authority' getting a jackpot then you might be convinced that Fred is somehow cheating or the dice are loaded.  It would be easy to make a convincing case against Fred just on the basis of the unlikeliness of him getting the jackpot by chance and his problematic history.

But now imagine Fred was just one of the 60 million people in the UK who all had a go at rolling the dice. It would actually be extremely unlikely if less than 25 of them hit the jackpot with fair dice (and without cheating) - the expected number is about 35. In any set of 25 people it is also extremely unlikely that there will not be at least one person who has a history of 'trouble with authority'. In fact you are likely to find something worse, since about 10 million people in the UK have criminal convictions, meaning that in a random set of 25 people there are likely to be about 5 with some criminal conviction.

So the fact that you find a character like Fred rolling 8 out of 8 sixes purely by chance is actually almost inevitable. There is nothing to see here and nothing to investigate. As we showed in Section 4.6.3 of our book (or in the examples here) many events which people think of as 'almost impossible'/'unbelievable' are in fact routine and inevitable.

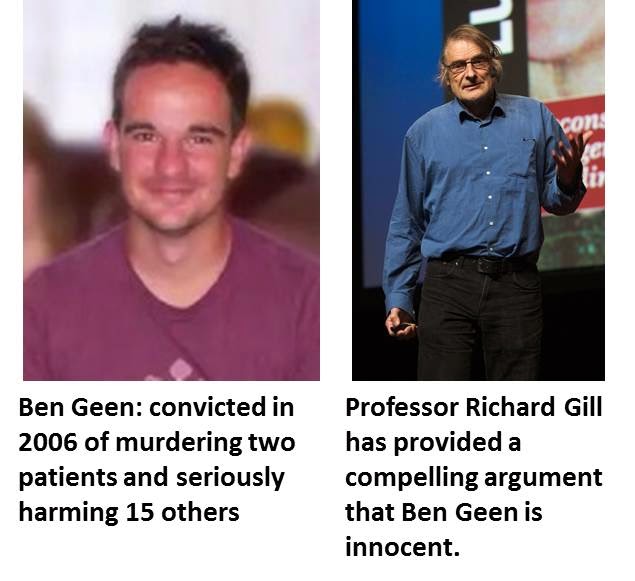
Now, instead of thinking about 'clusters' of sixes rolled from dice, think about clusters of patient deaths in hospitals. Just as Fred got his cluster of sixes, if you look hard enough it is inevitable you will find some nurses associated with abnormally high numbers of patient deaths. In Holland a nurse called Lucia deBerk was wrongly convicted of multiple murders as a result of investigators initially reading too much into such statistics (and then also getting the relevant probability calculations wrong). There have been other similar cases, and as my colleague Richard Gill explains so well it seems that Ben Geen may also have been the victim of such misunderstandings.

See also: Justice for Ben Geen

Update: See Richard Gill's excellent comments below

Update 16 Feb 2015: Guardian article talks about my statement made to the Criminal Cases Review Board.

From Richard Gill:

What happens in both Lucia and Ben's case is not only the surprising coincidence but the magnification of the coincidence, after it has been observed.

Doctors look back at past cases and start reclassifying them. So the dice analogy is not quite correct: it is more like you see someone rolling 5 out of 8 sixes (and it's someone you think is a bit odd in some way), and then you turn over the three non-sixes and make them into sixes too. The you go to the police: "8 out of 8".

This is exactly Lucia: 9 out of 9 - but actually three or four of those dice outcomes had been altered.

A further subtlety is that you never take the trouble to look at a further 20 dice-throws which had also been done and where, surprise surprise, there are only two or three sixes. The dice throws which are investigated are the ones which you remember. Part of the reason you remember them is exactly because that striking nurse about whom people have been gossiping was there.

Interestingly, just recently new cases started up in Italy and in Germany. They might be similar, they might not be. What is common is that the media immediately start spreading all kinds of extremely lurid tales, which, in the case of Lucia and of Ben, certainly turned out to be largely false, and even if there was a tiny snippet of truth in them, they were completely misleading. Here is what the UK media make of the Italian case: http://www.dailymail.co.uk/news/article-2798167/italian-nurse-murdered-38-patients-pleasure-enjoyed-challenge.html. Here is current German case. http://news.newsdirectory1.com/prosecution-nurses-should-have-murdered-100-times/ Sure, maybe these two really are serial killers. But maybe not. 

The dice throw analogy is very accurate. A typical full time nurse works roughly half of the days of the whole year (take account of holidays, training courses, absence due to illness, "weekends"), and then just one of the three hospital shifts on a day on which she works. 1 in 6 shifts. So if something odd happens on one of the shifts, there is 1 in 6 chance it happens on his/her shifts. However ... more incidents happen in weekends and some nurses have more than average weekend shifts. Then there is the question: which shift did some event actually happen in? There's a lot of leeway in attributing some developing medical situation to one particular shift. Then there is the question, which shift did the nurse have? There is overlap between shifts, and anyway, sometimes a nurse arrives earlier or leaves earlier. This gives hospital authorities a great deal of flexibility in compiling statistics of shifts with incidents, and shifts with a suspicious nurse. Both in the Ben Geen and in the Lucia de Berk case, a great deal of use was made of this "flexibility" in order to inflate what might well have been chance fluctuations into such powerful numbers that a statistical analysis becomes superfluous: anyone can see "this can't be chance". Indeed. It was not chance. The statistics were fabricated using a prior conviction on the part of investigators (medical doctors at the same hospital, not police investigators) that they have found a serial killer. After that, no-one doubts them.


How to measure anything

Douglas Hubbard (left) and Norman Fenton in London 15 Nov 2014.
If you want to know how to use measurement to reduce risk and uncertainty in a wide range of business applications, then there is no better book than Douglas Hubbard's "How to Measure Anything: Finding the Value of Intangibles in Business" (now in its 3rd edition). Douglas is also the author of the excellent "The Failure of Risk Management: Why It's Broken and How to Fix It".

Anyone who has read our Bayesian Networks book or the latest (3rd edition) of my Software Metrics book (the one I gave Douglas in the above picture!) will know how much his work has influenced us recently.

Although we have previously communicated about technical issues by email, today I had the pleasure of meeting Douglas for the first time when we were able to meet for lunch in London.We discussed numerous topics of mutual interest (including the problems with classical hypothesis testing - and how Bayes provides a better alternative, and evolving work on the 'value of information' which enables you to identify where to focus your measurement to optimise your decision-making).

Tuesday 17 June 2014

Proving referee bias with Bayesian networks

An article in today's Huffington Post by Raj Persaud and Adrian Furnham talks about the scientific evidence that supports the idea of referee bias in football. One of the studies they describe is the recent work by Anthony Constantinou, Norman Fenton and Liam Pollock** which developed a causal Bayesian network model to determine referee bias and applied it to the data from all matches played in the 2011-12 Premier League season. Here is what they say about our study:
Another recent study might just have scientifically confirmed this possible 'Ferguson Factor', entitled, 'Bayesian networks for unbiased assessment of referee bias in Association Football'. The term 'Bayesian networks', refers to a particular statistical technique deployed in this research, which mathematically analysed referee bias with respect to fouls and penalty kicks awarded during the 2011-12 English Premier League season.
The authors of the study, Anthony Constantinou, Norman Fenton and Liam Pollock found fairly strong referee bias, based on penalty kicks awarded, in favour of certain teams when playing at home.
Specifically, the two teams (Manchester City and Manchester United) who finished first and second in the league, appear to have benefited from bias that cannot be explained by other factors. For example a team may be awarded more penalties simply because it's more attacking, not just because referees are biased in its favour.

The authors from Queen Mary University of London, argue that if the home team is more in control of the ball, then, compared to opponents, it's bound to be awarded more penalties, with less yellow and red cards, compared to opponents. Greater possession leads any team being on the receiving end of more tackles. A higher proportion of these tackles are bound to be committed nearer to the opponent's goal, as greater possession also usually results in territorial advantage.
However, this study, published in the academic journal 'Psychology of Sport and Exercise', found, even allowing for these other possible factors, Manchester United with 9 penalties awarded during that season, was ranked 1st in positive referee bias, while Manchester City with 8 penalties awarded is ranked 2nd. In other words it looks like certain teams (most specifically Manchester United) benefited from referee bias in their favour during Home games, which cannot be explained by any other possible element of 'Home Advantage'. 
What makes this result particularly interesting, the authors argue, is that for most of the season, these were the only two teams fighting for the English Premiere League title. Were referees influenced by this, and it impacted on their decision-making?  Conversely the study found Arsenal, a team of similar popularity and wealth, and who finished third, benefited least of all 20 teams from referee bias at home, with respect to penalty kicks awarded. With the second largest average attendance as well as the second largest average crowd density, Arsenal were still ranked last in terms of referee bias favouring them for penalties awarded. In other words, Arsenal didn't seem to benefit much at all from the kind of referee bias that other teams were gaining from 'Home Advantage'. Psychologists might argue that temperament-wise, Sir Alex Ferguson and Arsene Wenger appear at opposite poles of the spectrum.
**  Constantinou, A. C., Fenton, N. E., & Pollock, L. (2014). "Bayesian networks for unbiased assessment of referee bias in Association Football". To appear in Psychology of Sport & Exercise. A pre-publication draft can be found here.

Our related work on using Bayesian networks to predict football results is discussed here.

Wednesday 2 April 2014

Statistics of Poverty

Norman Fenton, 2 April 2014

I was one of two plenary speakers at the Winchester Conference on Trust, Risk, Information and the Law yesterday (slides of my talk: "Improving Probability and Risk Assessment in the Law" are here).

The other plenary speaker was Matthew Reed (Chief Executive of the Children's Society) who spoke about "The role of trust and information in assessing risk and protecting the vulnerable". In his talk he made the very dramatic statement that
"one in every four children in the UK today lives in poverty"
He further said that the proportion had increased significantly over the last 25 years and showed no signs of improvement.

When questioned about the definition of child poverty he said he was using the Child Poverty Act 2010 definition which defines a child as living in poverty if they lived in a household whose income (which includes benefits) is less than 60% of the national median (see here).

Matthew Reed has a genuine and deep concern for the welfare of children. However, the definition is purely political and is as good an example of poor measurement and misuse of statistics as you can find. Imagine if every household was given an immediate income increase of 1000%  - this would mean the very poorest households with, say, a single unemployed parent and 2 children going from £18,000 to a fabulously wealthy £180,000 per year. Despite this, one in every four children would still be 'living in poverty' because the number of households whose income is less than 60% of the median has not changed.  If the median before was £35,000, then it is now £350,000 and everybody earning below  £210,000 is, by definition, 'living in poverty'.

At the other extreme if you could ensure that every household in the UK earns a similar amount, such as in Cuba where almost everybody earns $20 per month then the number of children 'living in poverty' is officially zero (since the median is $240 per year and nobody earns less than $144).

In fact, in any wealthy free-market economy whichever way you look at the definition it is loaded not only to exaggerate the number of people living in poverty but also to ensure (unless there is massive wealth redistribution to ensure every household income is close to the median level) there will always be a 'poverty' problem:
  • Households with children are much more likely to have one, rather than two, wage earners, so by definition households with children will dominate those below the median income level.
  • Over the last 20 years people have been having fewer children and having them later in life, which again means that an increasing proportion of the country's children inevitably live in households whose income is below the median (hence the 'significant increase in the proportion of children living in poverty over the last 25 years').
  • Families with large numbers of children (> 3) increasingly are in the immigrant community (Asia/Africa) whose households are disproportionately below the median income. 
Unless the plan is stop households on below median income from having children (also known as eugenics), the only way to achieve the stated objective of 'making child poverty history' (according to this definition) is to redistribute wealth so that no household income is less than 60% of the median (also known as communism). Judging by some of the people who have been pushing the 'poverty' definition and agenda it would seem the latter is indeed their real objective.


Bayesian network approach to Drug Economics Decision Making


Consider the following problem:
A relatively cheap drug (drug A) has been used for many years to treat patients with disease X. The drug is considered quite successful since data reveals that 85% of patients using it have a ‘good outcome’ which means they survive for at least 2 years. The drug is also quite cheap, costing on average $100 for a prolonged course. The overall “financial benefit” of the drug (which assumes a ‘good outcome’ is worth $5000 and is defined as this figure minus the cost) has a mean of $4985.

There is an alternative drug (drug B) that a number of specialists in disease X strongly recommend. However, the data reveals that only 65% of patients using drug B survive for at least 2 years (Fig. 1(b)). Moreover, the average cost of a prolonged course is $500. The overall “financial benefit” of the drug has a mean of just $2777.
On seeing the data the Health Authority recommends a ban against the use of drug B. Is this a rational decision?

The answer turns out to be no. The short paper here explains this using a simple Bayesian network model that you can run (by downloading the free copy of AgenaRisk)